
µIB:Motion Graphs
10 quick questions
Target: 10 Questions in 10 minutes |
||
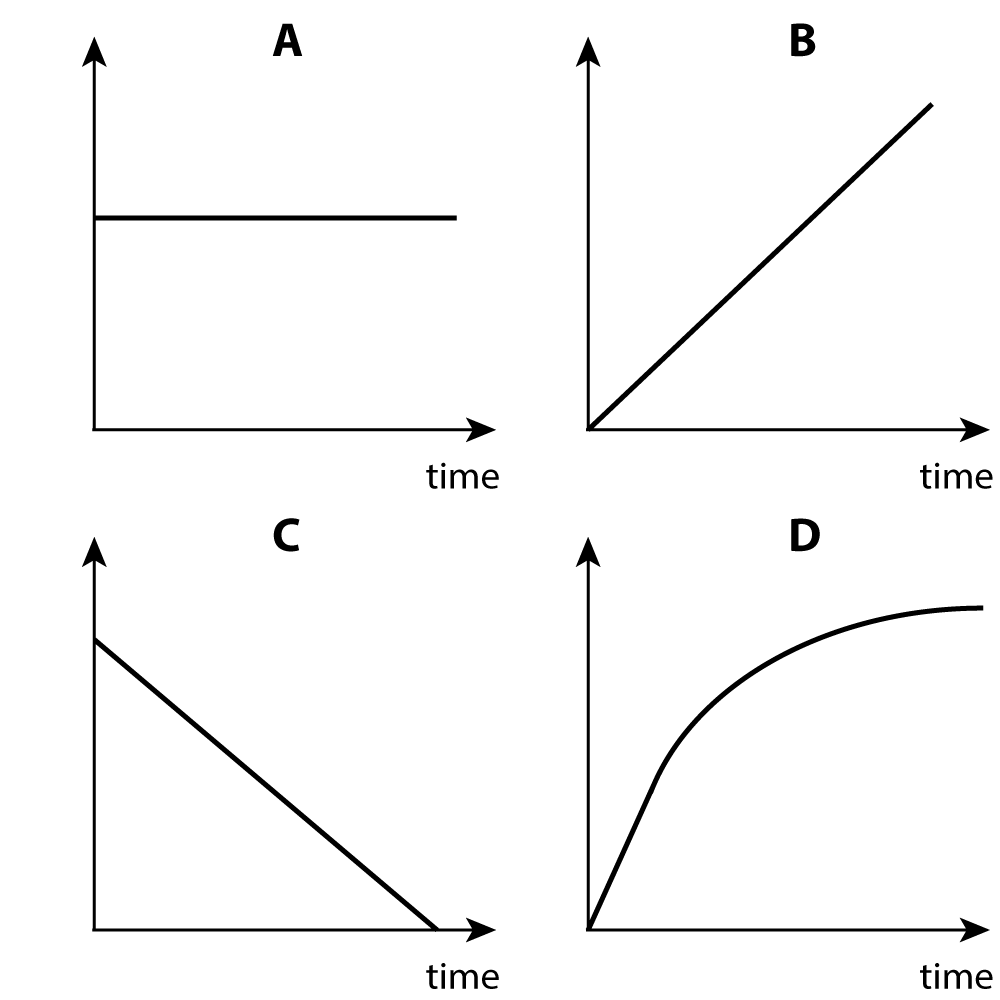
Q1-5. The 4 graphs below show options for questions 1 to 5.
Which of the graph lines above best represents.... |
|
|
1. ... a distance-time graph for a car moving at constant velocity away from the start point? |
||
2. ... a velocity-time graph for a falling steel ball? (ignoring air resistance). |
||
3. ... an acceleration-time graph for a falling steel ball? (ignoring air resistance). |
||
4. ... a velocity-time graph for a falling ping-pong ball, where air resistance is significant? | ||
5. ... a velocity-time graph for a runner decelerating at a uniform rate? | ||
6. A car accelerates from 10 m/s to 20 m/s. For the first part of the journey the acceleration is constant. The car then quickly reaches a final top speed. Which of these graphs shows the motion up to this point? |
||
|
||
| 7. This graph shows a bus approaching a traffic light. Which answer correctly states the total distance travelled and the final deceleration of the bus? | 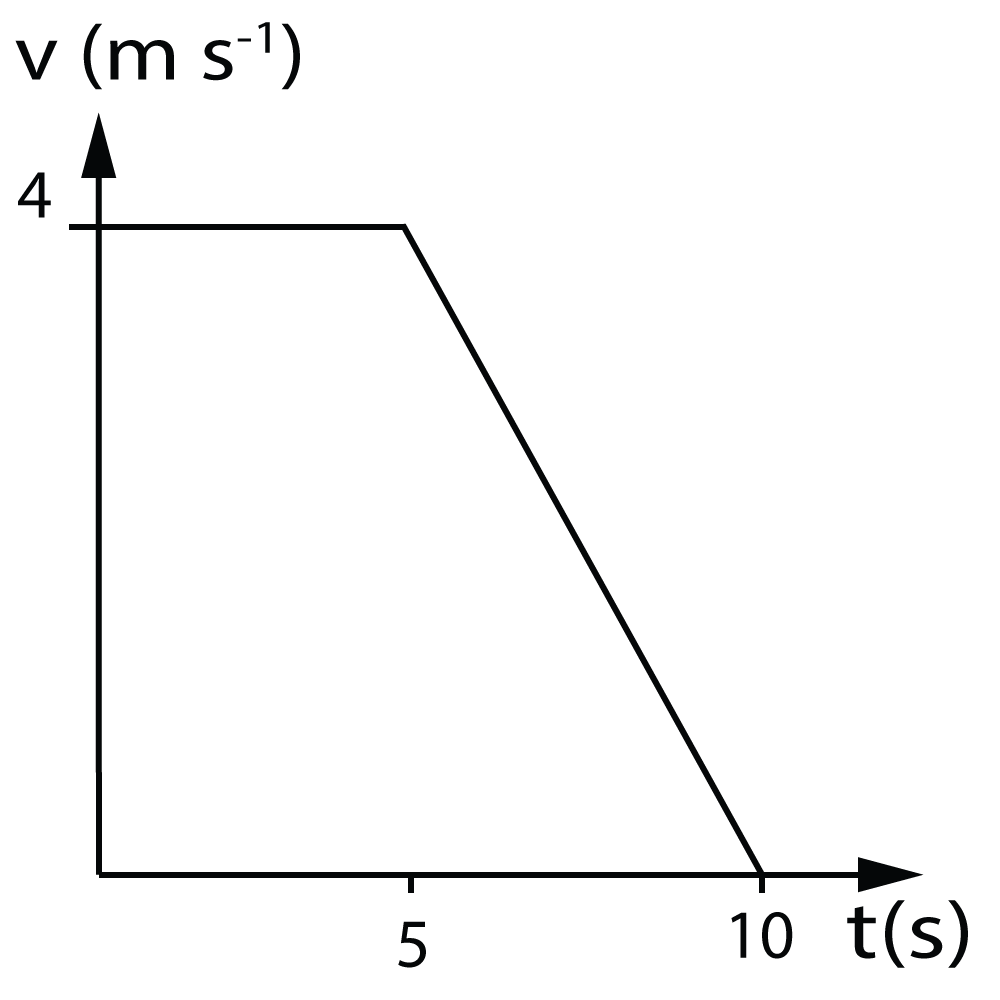 |
|
| ||
8-10. A very hard rubber ball is dropped by hand. It bounces off the floor and then returns to the hand with negligible loss of energy.
8.Which of the following graphs correctly shows the velocity of the ball during the journey? |
||

| ||
9. The acceleration of gravity can be obtained from the graph by finding..
| ||
10. The height of the drop can be obtained by finding..
| ||
Question 1:
Distance-Time Graph for a Car at Constant Velocity
The graph line that best represents a distance-time graph for a car moving at a constant velocity away from the start point is B. On a distance-time graph, velocity is the slope of the line. A constant velocity means the slope is constant and positive, which is represented by a straight line with a positive slope. The line goes from the origin, showing the car starts at a distance of zero and moves away.
*These A.I. responses have been individually checked to ensure they match the accepted answer, but explanations may still be incorrect. Responses may give guidance but the A.I. might not be able to answer the question! This is particularly the case for questions based on diagrams, which the A.I. typically cannot interpret.
Grade Gorilla uses Gemini, Deepseek and a range of other A.I. chatbots to generate the saved responses. Some answers have had human intervention for clarity or where the A.I. has not been able to answer the question.
Question 2:
Velocity-Time Graph for a Falling Steel Ball
The graph line for a falling steel ball, ignoring air resistance, is B. This is a velocity-time graph. When an object falls, its acceleration is constant and equal to gravity (g). Since acceleration is the slope on a velocity-time graph, and gravity is a constant, positive value, the graph must be a straight line with a constant, positive slope. The ball starts with zero velocity and speeds up at a constant rate.
*These A.I. responses have been individually checked to ensure they match the accepted answer, but explanations may still be incorrect. Responses may give guidance but the A.I. might not be able to answer the question! This is particularly the case for questions based on diagrams, which the A.I. typically cannot interpret.
Grade Gorilla uses Gemini, Deepseek and a range of other A.I. chatbots to generate the saved responses. Some answers have had human intervention for clarity or where the A.I. has not been able to answer the question.
Question 3:
Acceleration-Time Graph for a Falling Steel Ball
The graph line for a falling steel ball, ignoring air resistance, is A. This is an acceleration-time graph. As explained above, the acceleration of a falling object (without air resistance) is the constant value of gravity (g). A constant value is represented by a horizontal line, so the acceleration is constant over time.
*These A.I. responses have been individually checked to ensure they match the accepted answer, but explanations may still be incorrect. Responses may give guidance but the A.I. might not be able to answer the question! This is particularly the case for questions based on diagrams, which the A.I. typically cannot interpret.
Grade Gorilla uses Gemini, Deepseek and a range of other A.I. chatbots to generate the saved responses. Some answers have had human intervention for clarity or where the A.I. has not been able to answer the question.
Question 4:
The graph line for a falling ping-pong ball with significant air resistance is D. This is a velocity-time graph. Initially, the ball's velocity increases quickly because gravity is the dominant force. As the velocity increases, the force of air resistance also increases, opposing the motion. This reduces the net force and therefore the acceleration. The slope of the graph, representing acceleration, decreases over time, but the velocity continues to increase until air resistance equals the force of gravity. At this point, the net force is zero, acceleration becomes zero, and the ball reaches a constant terminal velocity. The graph becomes a horizontal line as the slope becomes zero.
*These A.I. responses have been individually checked to ensure they match the accepted answer, but explanations may still be incorrect. Responses may give guidance but the A.I. might not be able to answer the question! This is particularly the case for questions based on diagrams, which the A.I. typically cannot interpret.
Grade Gorilla uses Gemini, Deepseek and a range of other A.I. chatbots to generate the saved responses. Some answers have had human intervention for clarity or where the A.I. has not been able to answer the question.
Question 5:
The graph line for a runner decelerating at a uniform rate is C. This is a velocity-time graph. Deceleration is a negative acceleration. A uniform rate means the acceleration is constant. Therefore, the graph must be a straight line with a constant negative slope. This shows that the runner's velocity is decreasing at a steady rate over time.
*These A.I. responses have been individually checked to ensure they match the accepted answer, but explanations may still be incorrect. Responses may give guidance but the A.I. might not be able to answer the question! This is particularly the case for questions based on diagrams, which the A.I. typically cannot interpret.
Grade Gorilla uses Gemini, Deepseek and a range of other A.I. chatbots to generate the saved responses. Some answers have had human intervention for clarity or where the A.I. has not been able to answer the question.
Question 6:
Velocity-Time Graph: The graphs provided are velocity-time graphs. On a velocity-time graph, the slope of the line represents the acceleration.
Part 1: Constant Acceleration: The problem states that the car accelerates from 10 m/s to 20 m/s with constant acceleration for the first part of the journey. On a velocity-time graph, constant acceleration is represented by a straight line with a constant slope. This eliminates graph B. Graph C shows the car starting at zero which is incorrect.
Part 2: Quickly Reaching a Final Top Speed: After the initial constant acceleration, the car "quickly reaches a final top speed." This means the acceleration becomes zero. On a velocity-time graph, zero acceleration (constant velocity) is a horizontal line with a zero slope. This part of the journey is not a straight line up, as in graph A, but a curve that flattens out to a horizontal line as the car's velocity stops increasing. The transition from constant acceleration to zero acceleration is not instantaneous in real life, so the graph line becomes curved as the acceleration decreases to zero, and then becomes a horizontal line when the car reaches its top speed. This curved section, where acceleration is decreasing, is shown in graph D.
The correct graph, therefore, is D because it shows an initial straight-line section with a positive slope (constant acceleration) followed by a curved section that flattens out to a horizontal line (decreasing acceleration to a final constant speed).
*Edited by the Silverback
*These A.I. responses have been individually checked to ensure they match the accepted answer, but explanations may still be incorrect. Responses may give guidance but the A.I. might not be able to answer the question! This is particularly the case for questions based on diagrams, which the A.I. typically cannot interpret.
Grade Gorilla uses Gemini, Deepseek and a range of other A.I. chatbots to generate the saved responses. Some answers have had human intervention for clarity or where the A.I. has not been able to answer the question.
Question 7:
Total Distance
To find the total distance, you need to calculate the area under the velocity-time graph. The graph is composed of a rectangle and a triangle.
Distance during constant velocity:
Distance
=velocity×time
Distance
= 4 m/s × 5 s = 20 m
Distance during deceleration:
This is the area of the triangle.
Distance = ½ × base × height
The base of the triangle is the time the bus decelerated, which is 5 seconds. The height is the change in velocity, which is from 4 m/s to 0 m/s (as the bus stops at the traffic light).
Distance
½ ×
×5s × 4 m/s = 10 m
Total Distance:
Total Distance=20 m+10 m=30 m
Final Deceleration
Deceleration is the rate at which an object slows down. On a velocity-time graph, it is the negative slope of the line.
Deceleration= Change in Velocity /
Time taken
Change in Velocity = (-) 4 m/s
Time taken = 5 s
Deceleration=
-4 / 5
=−0.8 m/s2
The negative sign indicates deceleration. The magnitude of the deceleration is 0.8 m/s2.
The correct answer is C.
The bus travels a total distance of 30 meters with a final deceleration of 0.8 m/s2.
*These A.I. responses have been individually checked to ensure they match the accepted answer, but explanations may still be incorrect. Responses may give guidance but the A.I. might not be able to answer the question! This is particularly the case for questions based on diagrams, which the A.I. typically cannot interpret.
Grade Gorilla uses Gemini, Deepseek and a range of other A.I. chatbots to generate the saved responses. Some answers have had human intervention for clarity or where the A.I. has not been able to answer the question.
Question 8:
The velocity-time graph for a bouncing rubber ball, with positive velocity being downwards and negligible energy loss, would be a series of straight, parallel lines.
Ball Dropped from Hand: The graph starts at the origin (0, 0) because the ball is dropped from rest. As it falls, its velocity increases at a constant rate due to gravity. Since we've defined positive velocity as downwards, the velocity increases linearly, so the graph is a straight line with a positive slope. This slope represents the acceleration due to gravity ().
Impact with the Floor: When the ball hits the floor, its direction of travel reverses. Since there's negligible energy loss, the speed just before the bounce is equal to the speed just after the bounce. The velocity, however, becomes negative because the ball is now moving upwards. This change in velocity happens almost instantaneously, so the graph shows a vertical line that instantly jumps from a positive velocity value to an equal negative velocity value.
Ball Bouncing Upwards: As the ball travels upwards, gravity is still acting on it, causing it to decelerate. The velocity decreases linearly from its negative value back to zero at the peak of the bounce. The slope of this line is negative, representing the acceleration due to gravity, which is always directed downwards.
Returning to the Hand: When the ball reaches its peak height, its velocity is momentarily zero. It then begins to fall again, and the process repeats.
In summary, the graph is a repeating "zigzag" pattern. The falling segment is a straight line with a positive slope. The bouncing segment is a vertical line. The rising segment is a straight line with an equal, but negative, slope. Since energy loss is negligible, the magnitude of the velocity at each impact point and at the starting and ending points remains the same, so the zigzag pattern is perfectly symmetrical.
*These A.I. responses have been individually checked to ensure they match the accepted answer, but explanations may still be incorrect. Responses may give guidance but the A.I. might not be able to answer the question! This is particularly the case for questions based on diagrams, which the A.I. typically cannot interpret.
Grade Gorilla uses Gemini, Deepseek and a range of other A.I. chatbots to generate the saved responses. Some answers have had human intervention for clarity or where the A.I. has not been able to answer the question.
Question 9:
To find the acceleration from a velocity-time graph, you need to calculate the slope (or gradient) of the line.
This corresponds to answer C.
*These A.I. responses have been individually checked to ensure they match the accepted answer, but explanations may still be incorrect. Responses may give guidance but the A.I. might not be able to answer the question! This is particularly the case for questions based on diagrams, which the A.I. typically cannot interpret.
Grade Gorilla uses Gemini, Deepseek and a range of other A.I. chatbots to generate the saved responses. Some answers have had human intervention for clarity or where the A.I. has not been able to answer the question.
Question 10:
To find the drop height from a velocity-time graph, you need to calculate the area under the graph for the segment that represents the ball's fall.
This is because the area under a velocity-time graph represents the displacement (or distance traveled).
The shape of the graph for the falling segment is a triangle. The formula for the area of a triangle is:
½ × base × height
The base of the triangle is the time the ball was falling.
The height of the triangle is the final velocity of the ball just before it hits the ground.
Therefore, the drop height can be calculated as:
Drop Height= ½ ×
×time taken to drop × final velocity
To find the drop height, we only need the area of the initial triange, and this corresponds to answer D.
*These A.I. responses have been individually checked to ensure they match the accepted answer, but explanations may still be incorrect. Responses may give guidance but the A.I. might not be able to answer the question! This is particularly the case for questions based on diagrams, which the A.I. typically cannot interpret.
Grade Gorilla uses Gemini, Deepseek and a range of other A.I. chatbots to generate the saved responses. Some answers have had human intervention for clarity or where the A.I. has not been able to answer the question.