
µIB:Thermal
10 quick questions
|
10 minutes maximum! Can you do it in 5? |
|||||||||||||||||
1. Steam has a high internal energy and can cause severe burns. Internal energy is defined as...
|
|||||||||||||||||
2. 1 kg of sea water at 20 0C has a specific heat capacity of cw. What is the specific heat capacity of 2 kg of sea water at 40 0C?
|
|||||||||||||||||
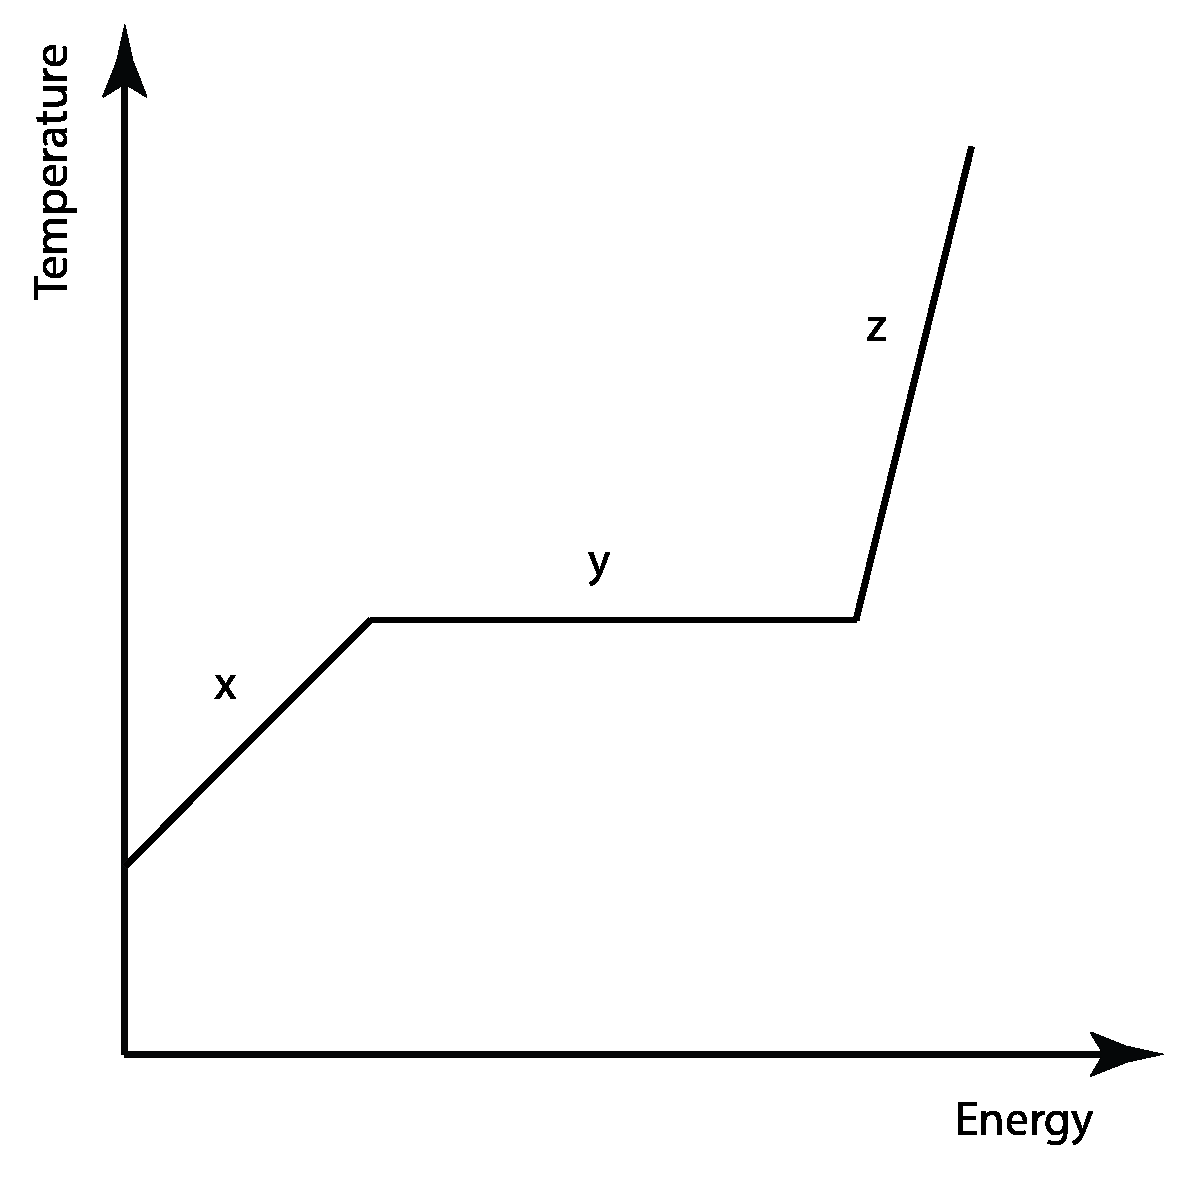
3-5. The graph shown below shows the temperature change of solid lead as heat energy is supplied, and the lead melts. Heat energy is transferred at a constant rate.
|
|||||||||||||||||
3. Which feature of the graph above shows the specific heat capacity of solid lead?
|
|||||||||||||||||
4. Which feature of the graph above shows the specific heat capacity of liquid lead?
| |||||||||||||||||
5. Which feature of the graph above shows the latent heat of fusion of lead?
| |||||||||||||||||
6. The temperature of 2 substances, P and Q, are stated as 200 0C and -100 0C. In units of kelvin (K), this is....
|
|||||||||||||||||
| 7. Approximately 4000 J of energy is needed to heat 1 kg of copper by 10 0C. How much energy is needed to heat 0.5 kg of copper by 40 0C? |
|
||||||||||||||||
|
| ||||||||||||||||
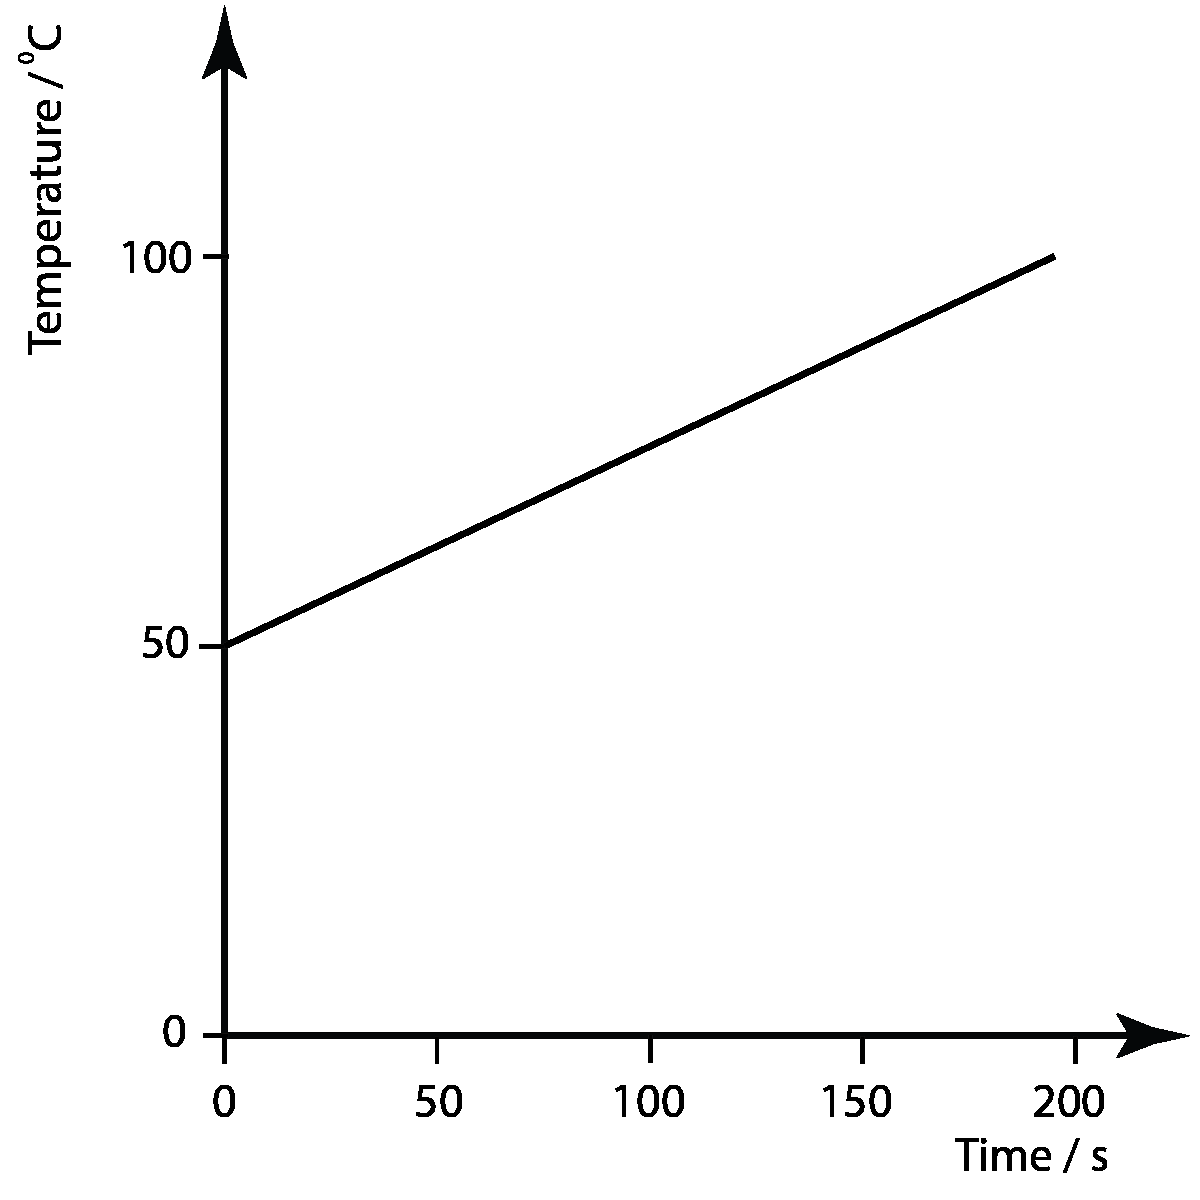
8-10. A sample of 1 kg of liquid is heated by a 100 W electric heater. The graph shows the increase in temperature with time:
|
|||||||||||||||||
8. What is total heat energy Q suppiled to the liquid in this time?
| |||||||||||||||||
9. Which of the following formulas can be used to calculate the specific heat capacity c of the liquid? | |||||||||||||||||
10. The experiment is repeated, once with double the mass of the same liquid, and a second time with a liquid of lower specific heat capacity. What effect would this have on the gradient of the graph above?
| |||||||||||||||||