
µIB:Motion Graphs
10 quick questions
10 minutes maximum! Can you do it in 5? |
||
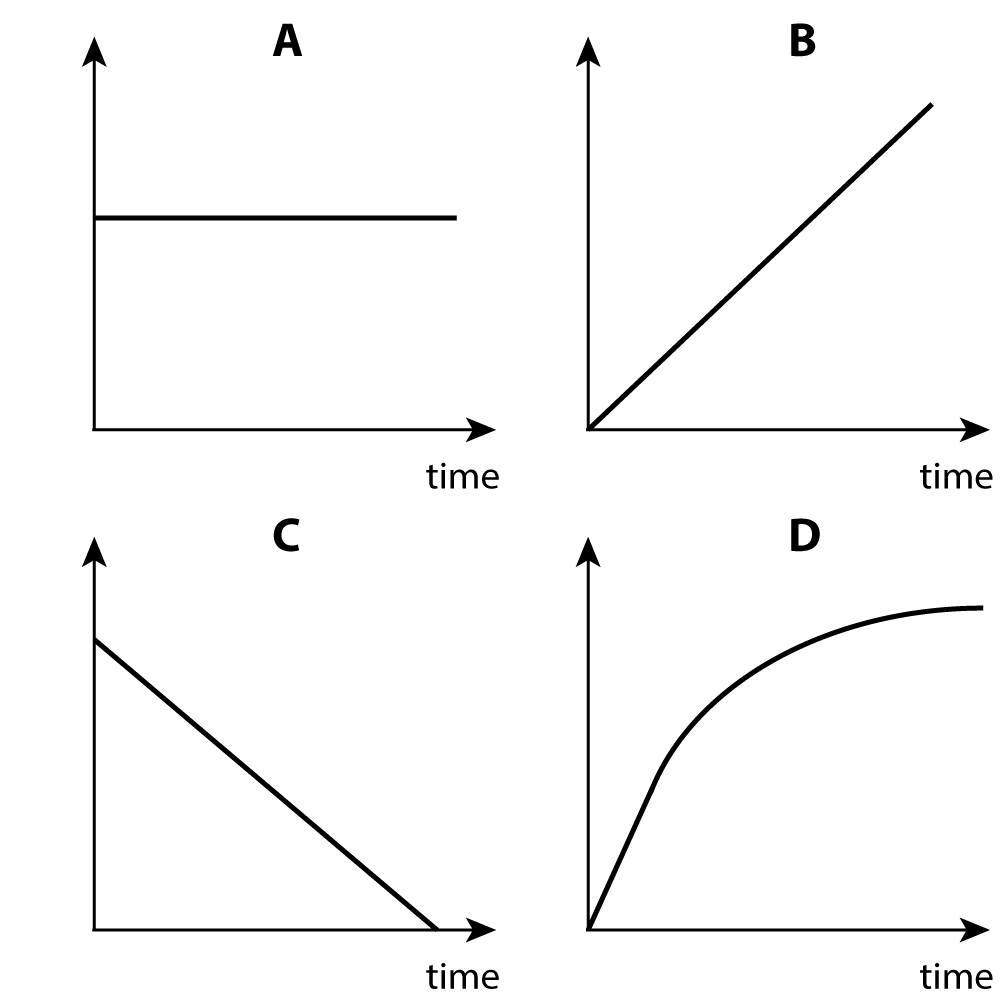
Q1-5. The 4 graphs below show options for questions 1 to 5.
Which of the graph lines above best represents.... |
|
|
1. ... a distance-time graph for a car moving at constant velocity away from the start point? |
||
2. ... a velocity-time graph for a falling steel ball? (ignoring air resistance). |
||
3. ... an acceleration-time graph for a falling steel ball? (ignoring air resistance). |
||
4. ... a velocity-time graph for a falling ping-pong ball, where air resistance is significant? | ||
5. ... a velocity-time graph for a runner decelerating at a uniform rate? | ||
6. A car accelerates from 10 m/s to 20 m/s. For the first part of the journey the acceleration is constant. The car then quickly reaches a final top speed. Which of these graphs shows the motion up to this point? |
||
|
||
| 7. This graph shows a bus approaching a traffic light. Which answer correctly states the total distance travelled and the final deceleration of the bus? | 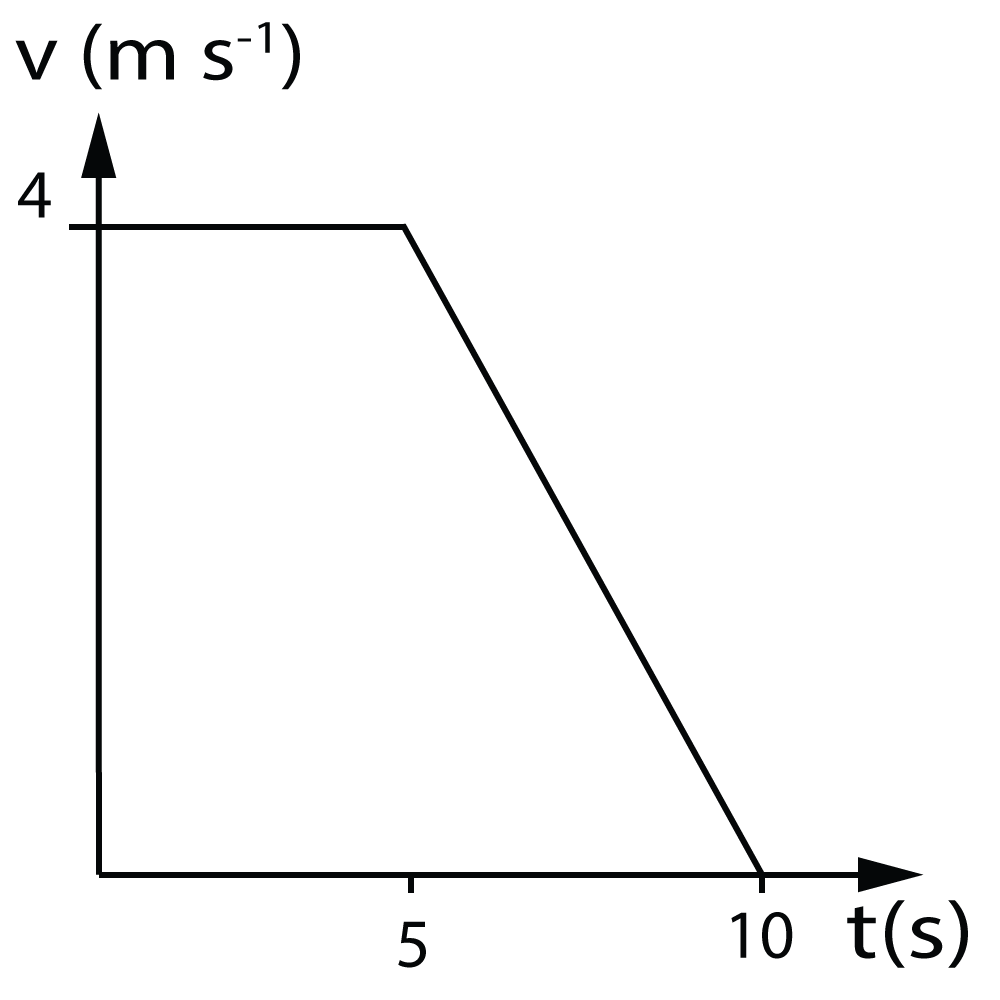 |
|
| ||
8-10. A very hard rubber ball is dropped by hand. It bounces off the floor and then returns to the hand with negligible loss of energy.
8.Which of the following graphs correctly shows the velocity of the ball during the journey? |
||

| ||
9. The acceleration of gravity can be obtained from the graph by finding..
| ||
10. The height of the drop can be obtained by finding..
| ||